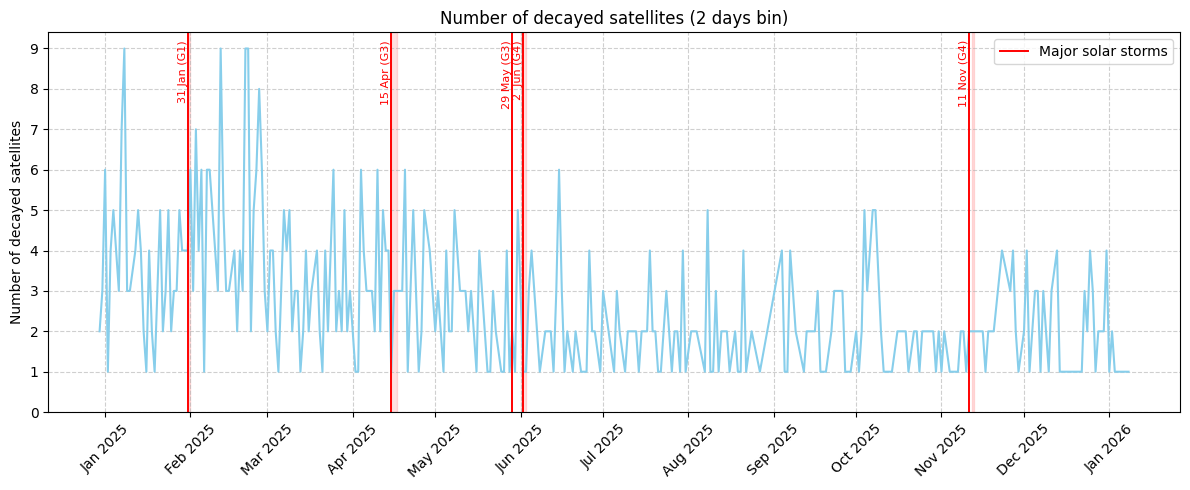
Between late 2024 and May 2025, a higher-than-average frequency of satellite reentries was observed.
This increase is mainly due to the controlled reentry of numerous first-generation Starlink satellites
SpaceWeather, August 6, 2025.
In the graph showing the number of satellites that have reentered, the dates of the main solar storms of 2025 are also indicated. It can be seen that these storms
did not significantly affect satellite reentries, although they did contribute to an increase in orbital correction maneuvers
SpaceWeather, December 19, 2025.
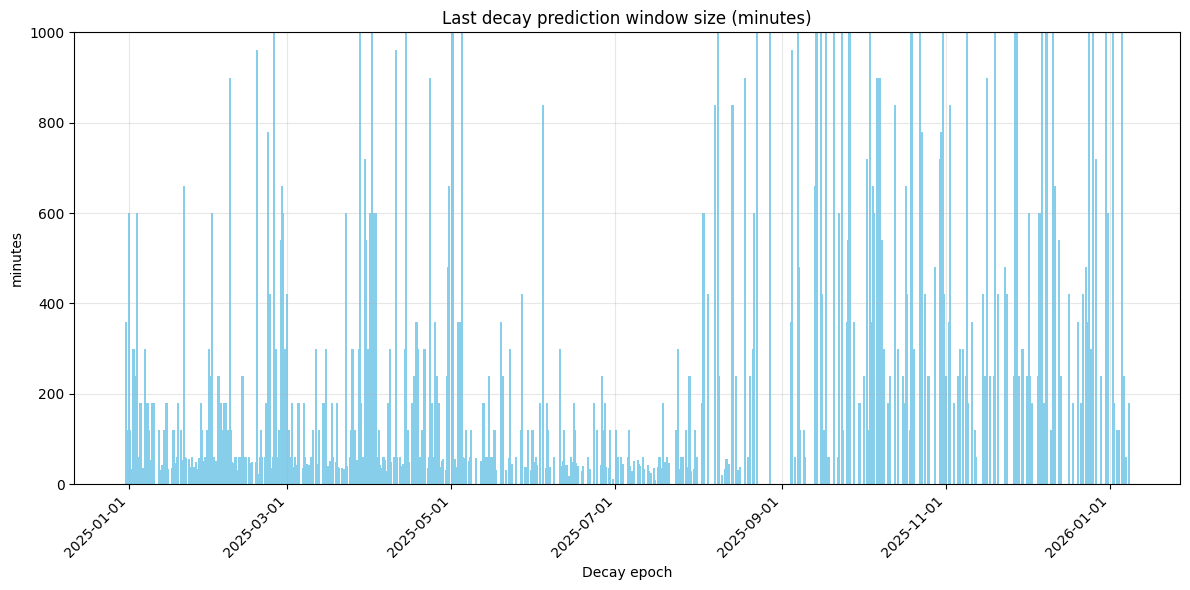
 Regarding the uncertainty window for reentry dates
. As shown in the related graph, from early September 2025 this window increased
significantly. After a blackout period of the Space-Track data provider,
monitoring operations resumed; however, from that point onward, predictions of
satellite reentry dates became much more uncertain. This increase in uncertainty
windows makes reliable predictions for satellite reentry notifications more difficult.
Regarding the uncertainty window for reentry dates
. As shown in the related graph, from early September 2025 this window increased
significantly. After a blackout period of the Space-Track data provider,
monitoring operations resumed; however, from that point onward, predictions of
satellite reentry dates became much more uncertain. This increase in uncertainty
windows makes reliable predictions for satellite reentry notifications more difficult.
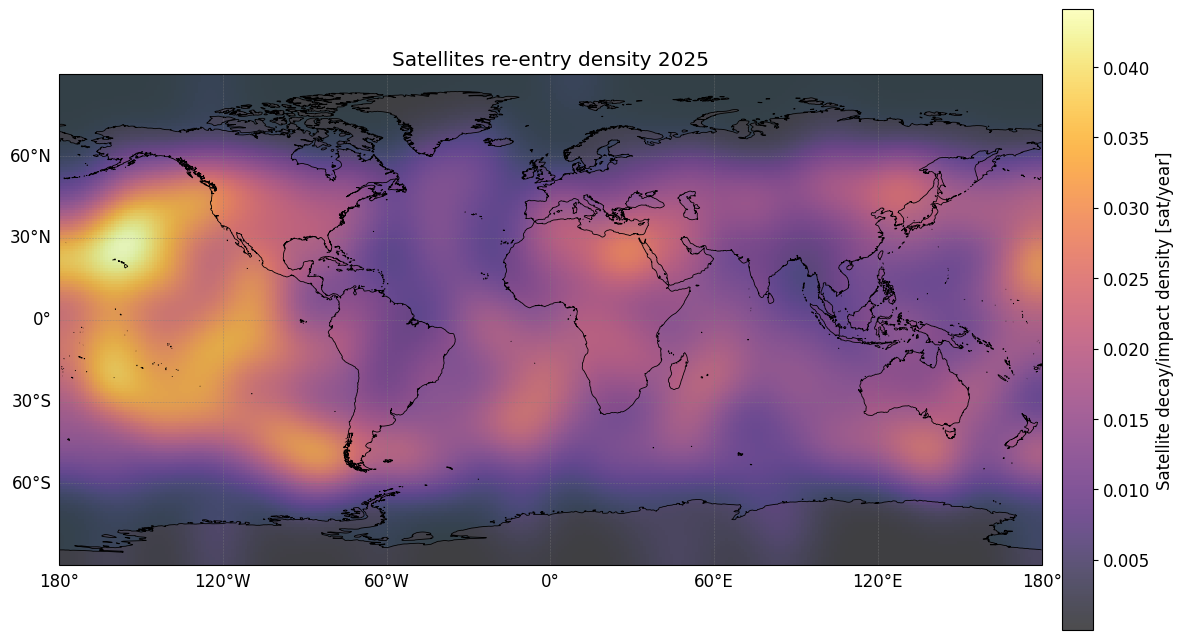
 By analyzing the map of satellite reentry distribution on Earth, one can observe areas where
satellites are deliberately deorbited in a controlled manner, such as the Pacific Ocean, in particular the region near Hawaii.
By analyzing the map of satellite reentry distribution on Earth, one can observe areas where
satellites are deliberately deorbited in a controlled manner, such as the Pacific Ocean, in particular the region near Hawaii.
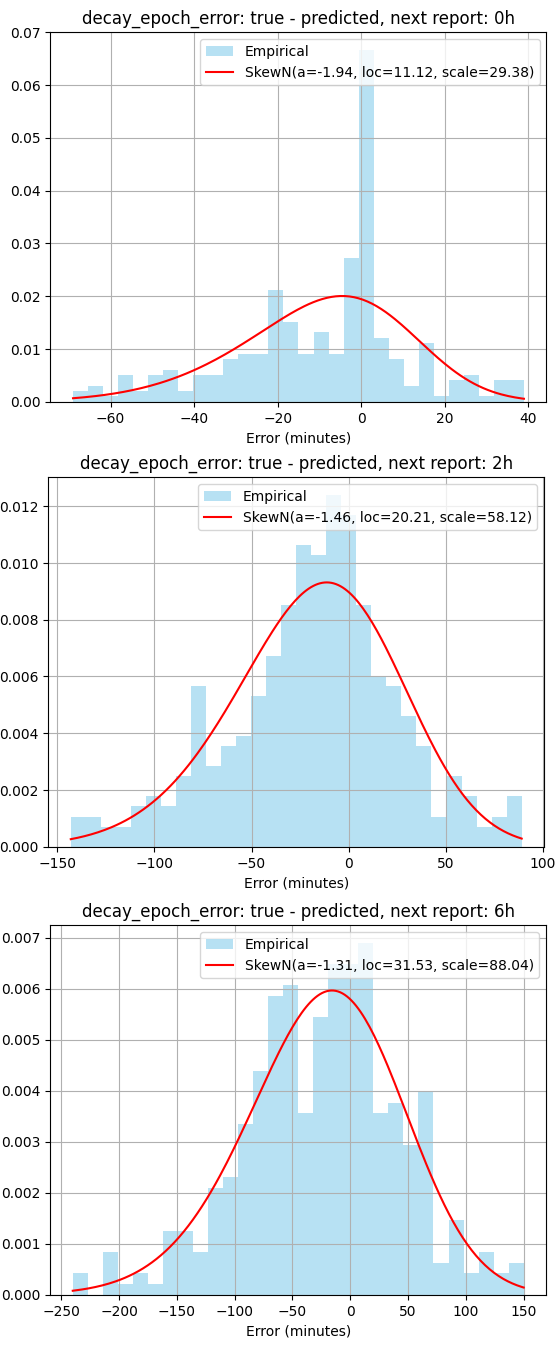
 The next graphs show the distribution of the reentry date prediction error for each satellite, for a specific report.
The term Next_report refers to how many hours remain until the next report. The smaller this value is,
the more accurate the reentry date prediction is expected to be, and therefore the prediction error calculated as true date − predicted date should be smaller.
Negative error values indicate that the predicted reentry date is too late (the satellite reenters earlier than predicted), while positive values indicate that the predicted reentry date is too early (the satellite reenters later than predicted).
For example, the report with Next_report = 0h refers to the last report before the satellite reentry, i.e., the final prediction before reentry occurs.
As can be seen from these graphs, which were fitted with skew normal distribution, on average the reentry date predictions are delayed with respect to the true reentry date;
the Space-Track prediction system tends to predict reentry dates that are later than the actual ones.
This is particularly evident for the 6h and 2h reports, and the skew normal fits well. While for the 0h report a peak is observed around zero,
indicating that the last report before reentry usually predicts the reentry time quite accurately (with only a few minutes of deviation), although a residual shift toward negative values of about 10 minutes is still present.
From the table is evident the trend of decreasing standard deviation as the reentry date approaches, indicating that predictions become more accurate closer to the actual reentry time.
The next graphs show the distribution of the reentry date prediction error for each satellite, for a specific report.
The term Next_report refers to how many hours remain until the next report. The smaller this value is,
the more accurate the reentry date prediction is expected to be, and therefore the prediction error calculated as true date − predicted date should be smaller.
Negative error values indicate that the predicted reentry date is too late (the satellite reenters earlier than predicted), while positive values indicate that the predicted reentry date is too early (the satellite reenters later than predicted).
For example, the report with Next_report = 0h refers to the last report before the satellite reentry, i.e., the final prediction before reentry occurs.
As can be seen from these graphs, which were fitted with skew normal distribution, on average the reentry date predictions are delayed with respect to the true reentry date;
the Space-Track prediction system tends to predict reentry dates that are later than the actual ones.
This is particularly evident for the 6h and 2h reports, and the skew normal fits well. While for the 0h report a peak is observed around zero,
indicating that the last report before reentry usually predicts the reentry time quite accurately (with only a few minutes of deviation), although a residual shift toward negative values of about 10 minutes is still present.
From the table is evident the trend of decreasing standard deviation as the reentry date approaches, indicating that predictions become more accurate closer to the actual reentry time.
The skew normal distribution used for the fit is defined by:
\[f(x; a, \text{loc}, \text{scale}) = \frac{2}{\text{scale}}\,\varphi\left(\frac{x-\text{loc}}{\text{scale}}\right)\,\Phi\left(a\,\frac{x-\text{loc}}{\text{scale}}\right)\]
where \(\varphi(z)=\frac{1}{\sqrt{2\pi}}e^{-z^{2}/2}\) and \(\Phi(z)\) is the standard normal cumulative distribution function.
The mean and standard deviation of the skew normal distribution are:
\(\text{mean} = \text{loc} + \text{scale}\,\delta\sqrt{\frac{2}{\pi}}\)
\(\text{std} = \text{scale}\sqrt{1 - \frac{2\delta^{2}}{\pi}}\)
with \(\delta = \frac{a}{\sqrt{1+a^{2}}}.\)
| Next Report | a | loc | scale |
|---|---|---|---|
| 72 h | -0.93 | -170.43 | 970.38 |
| 48 h | 0.58 | -678.09 | 568.34 |
| 24 h | -1.82 | 114.71 | 114.71 |
| 12 h | -1.66 | 72.37 | 179.49 |
| 6 h | -1.31 | 31.53 | 88.04 |
| 2 h | -1.46 | 20.21 | 58.12 |
| 0 h | -1.94 | 11.12 | 29.38 |